A closer look at the administrator’s workspace.
Supporting screens for the proposed Collections experience, refined from my original wireframes. The main case study focuses on the decisions; this gallery shows the wider interface.
All account data, performance figures and AI recommendations are illustrative. These are design concepts, not evidence of shipped integrations, validated predictions or measured project outcomes. The screens preserve separate wireframe scenarios; their dates and example values are not a single reconciled dataset.
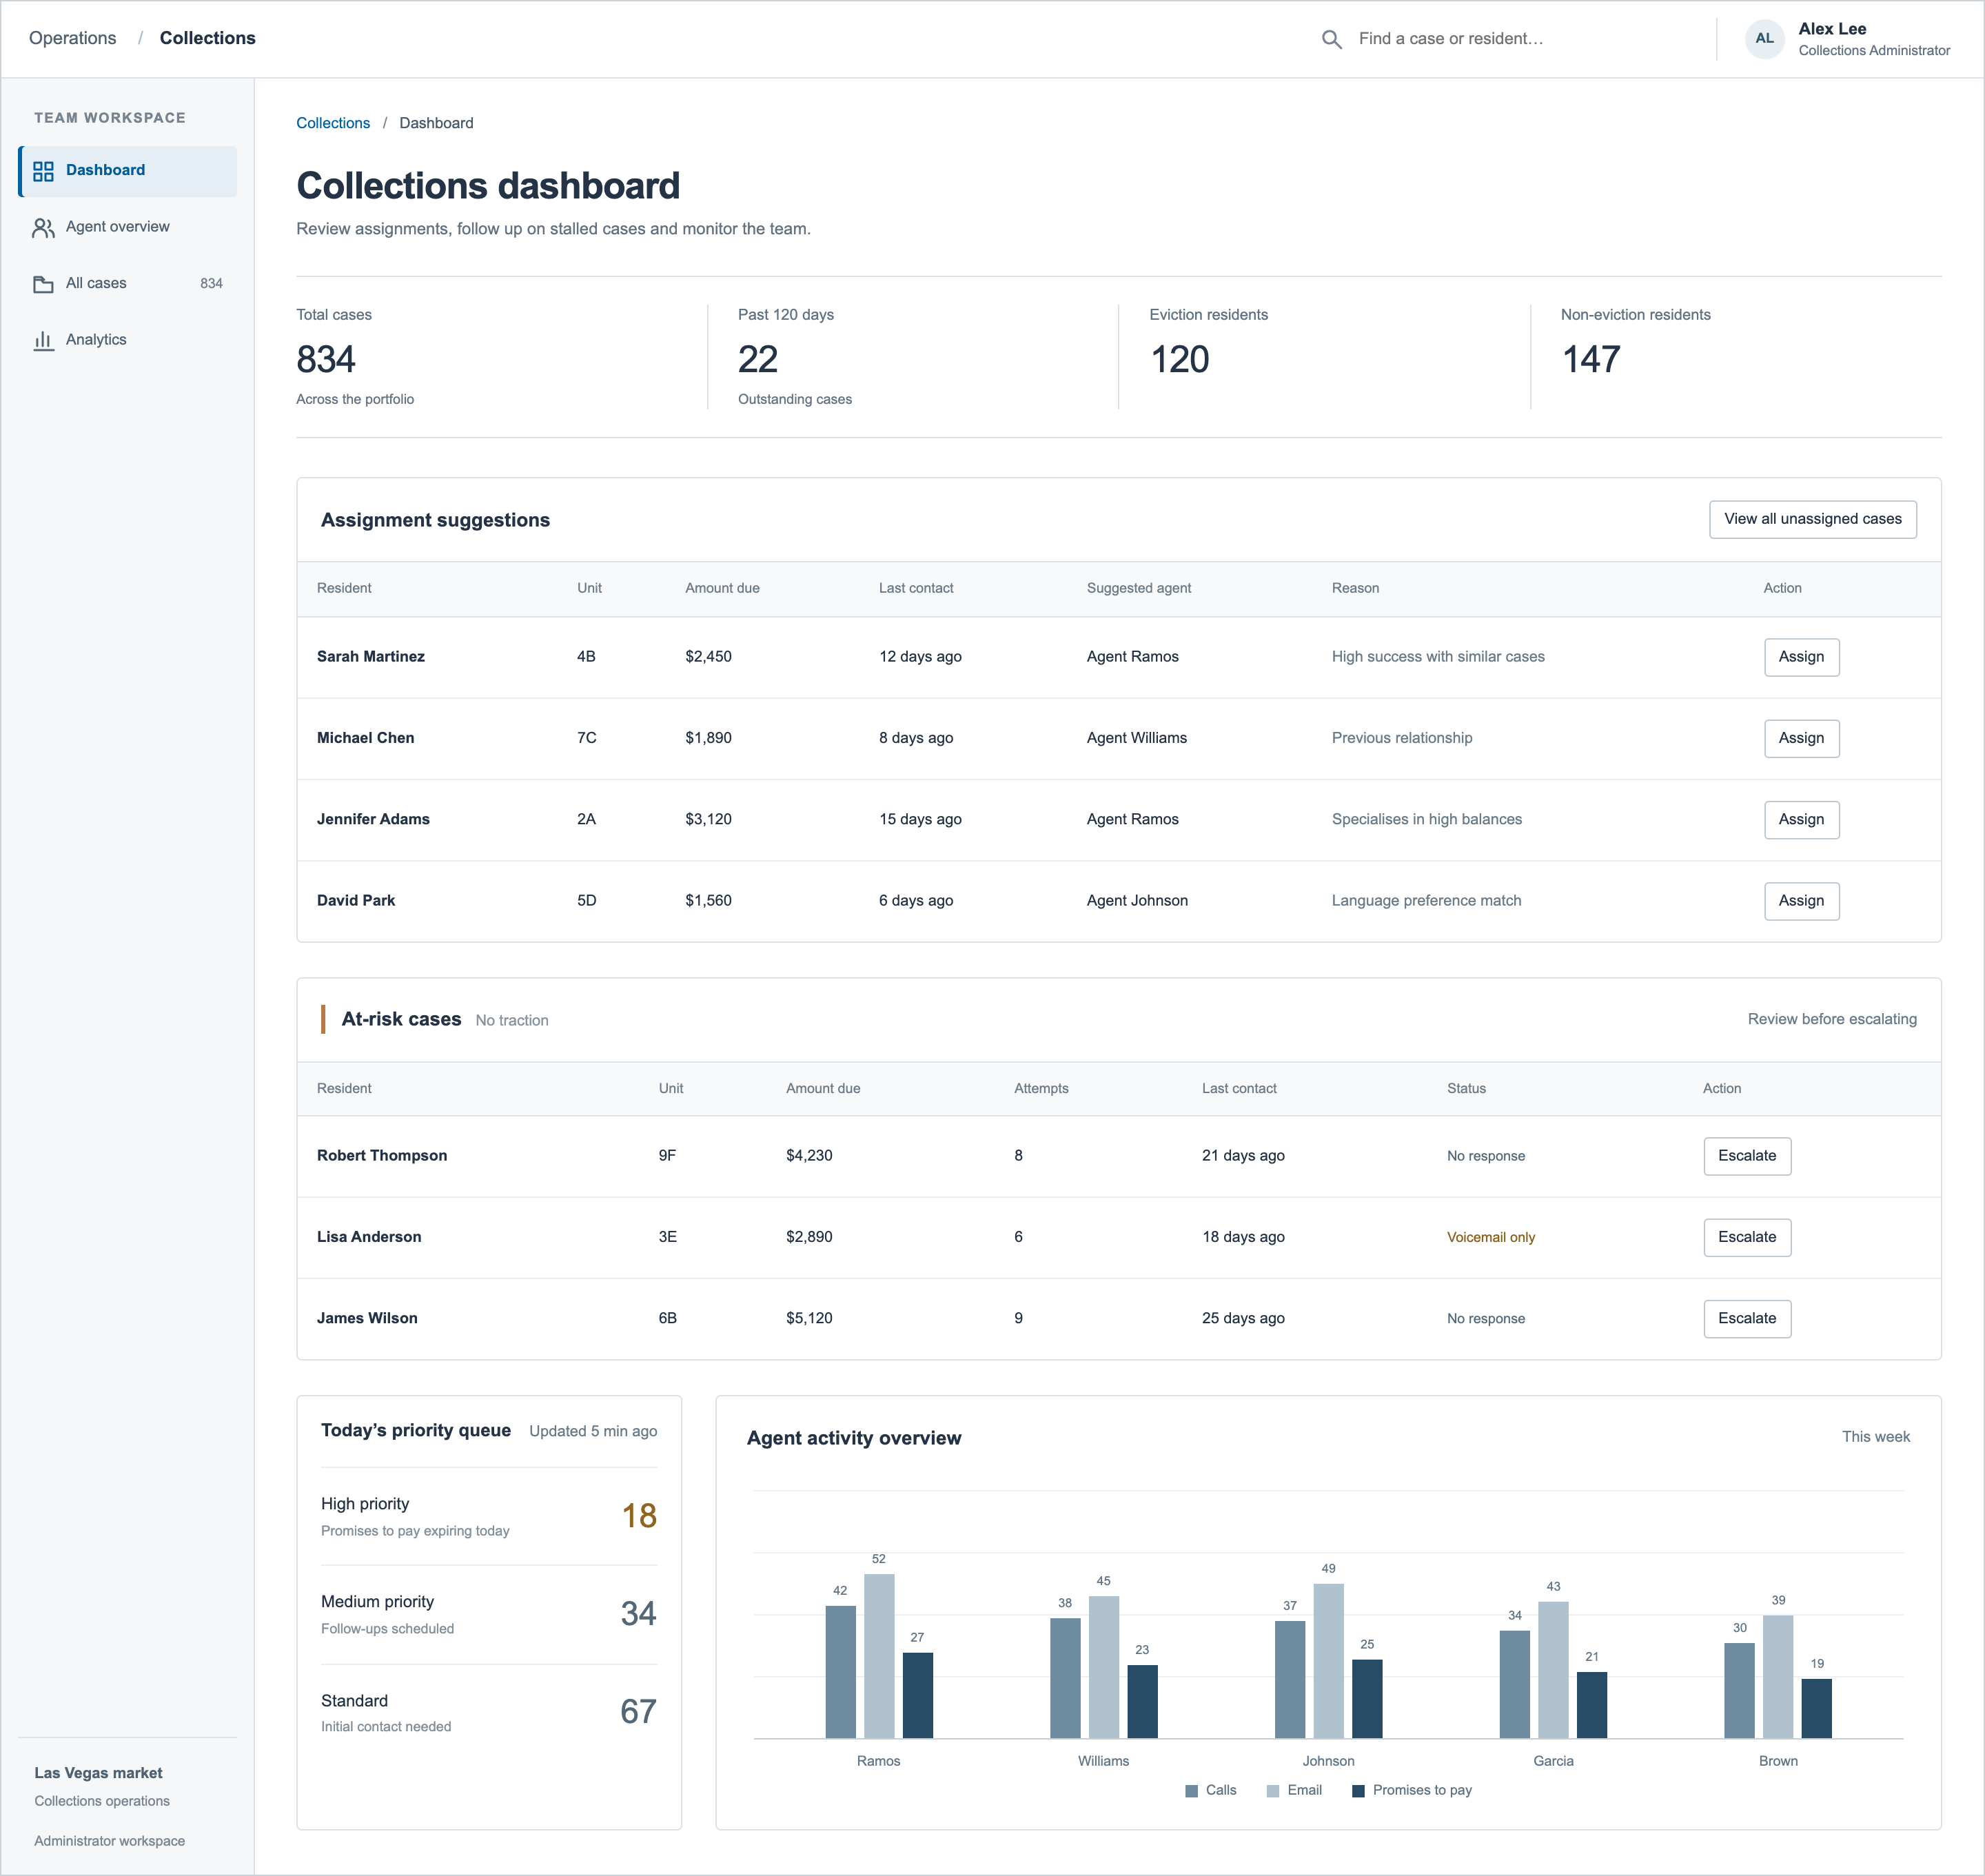
01 / Administrator dashboard
Assignment suggestions and stalled cases provide starting points for review, with priorities and team activity available below.
 Inspect full-size image ↗
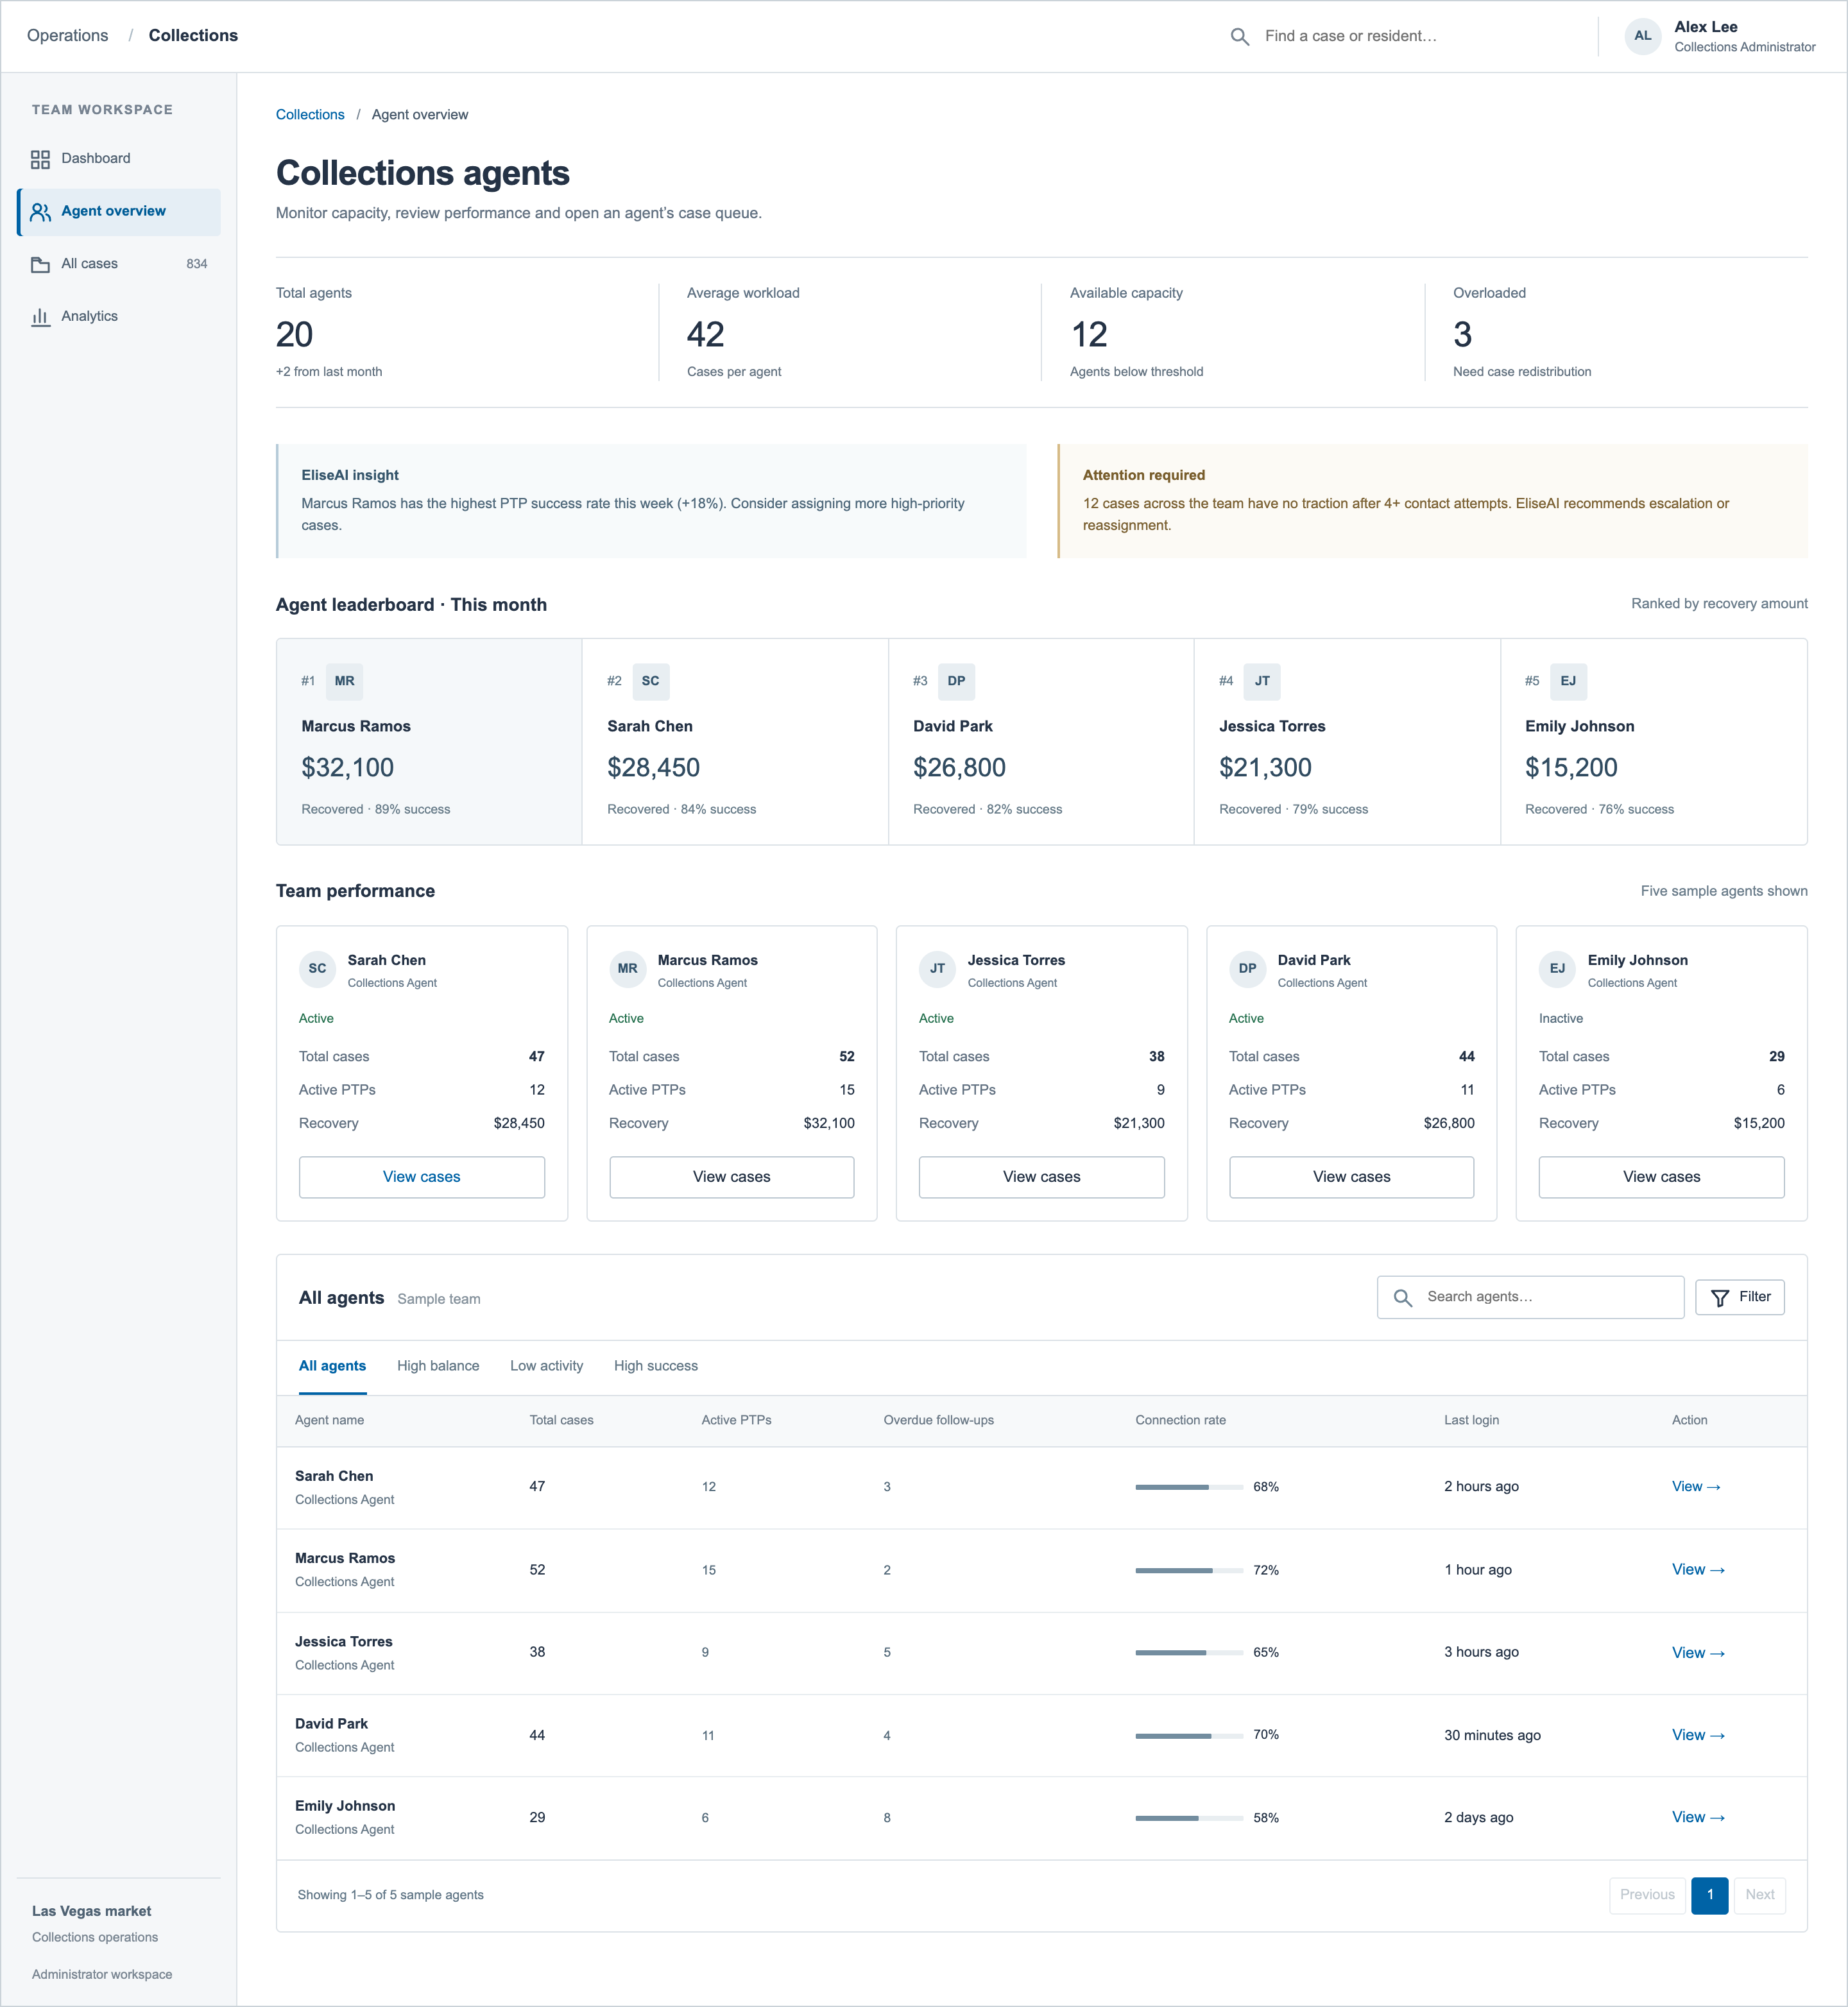
02 / Agent overview
A team-level view of workload, recovery and follow-ups. Five sample agents illustrate the proposed layout.
 Inspect full-size image ↗
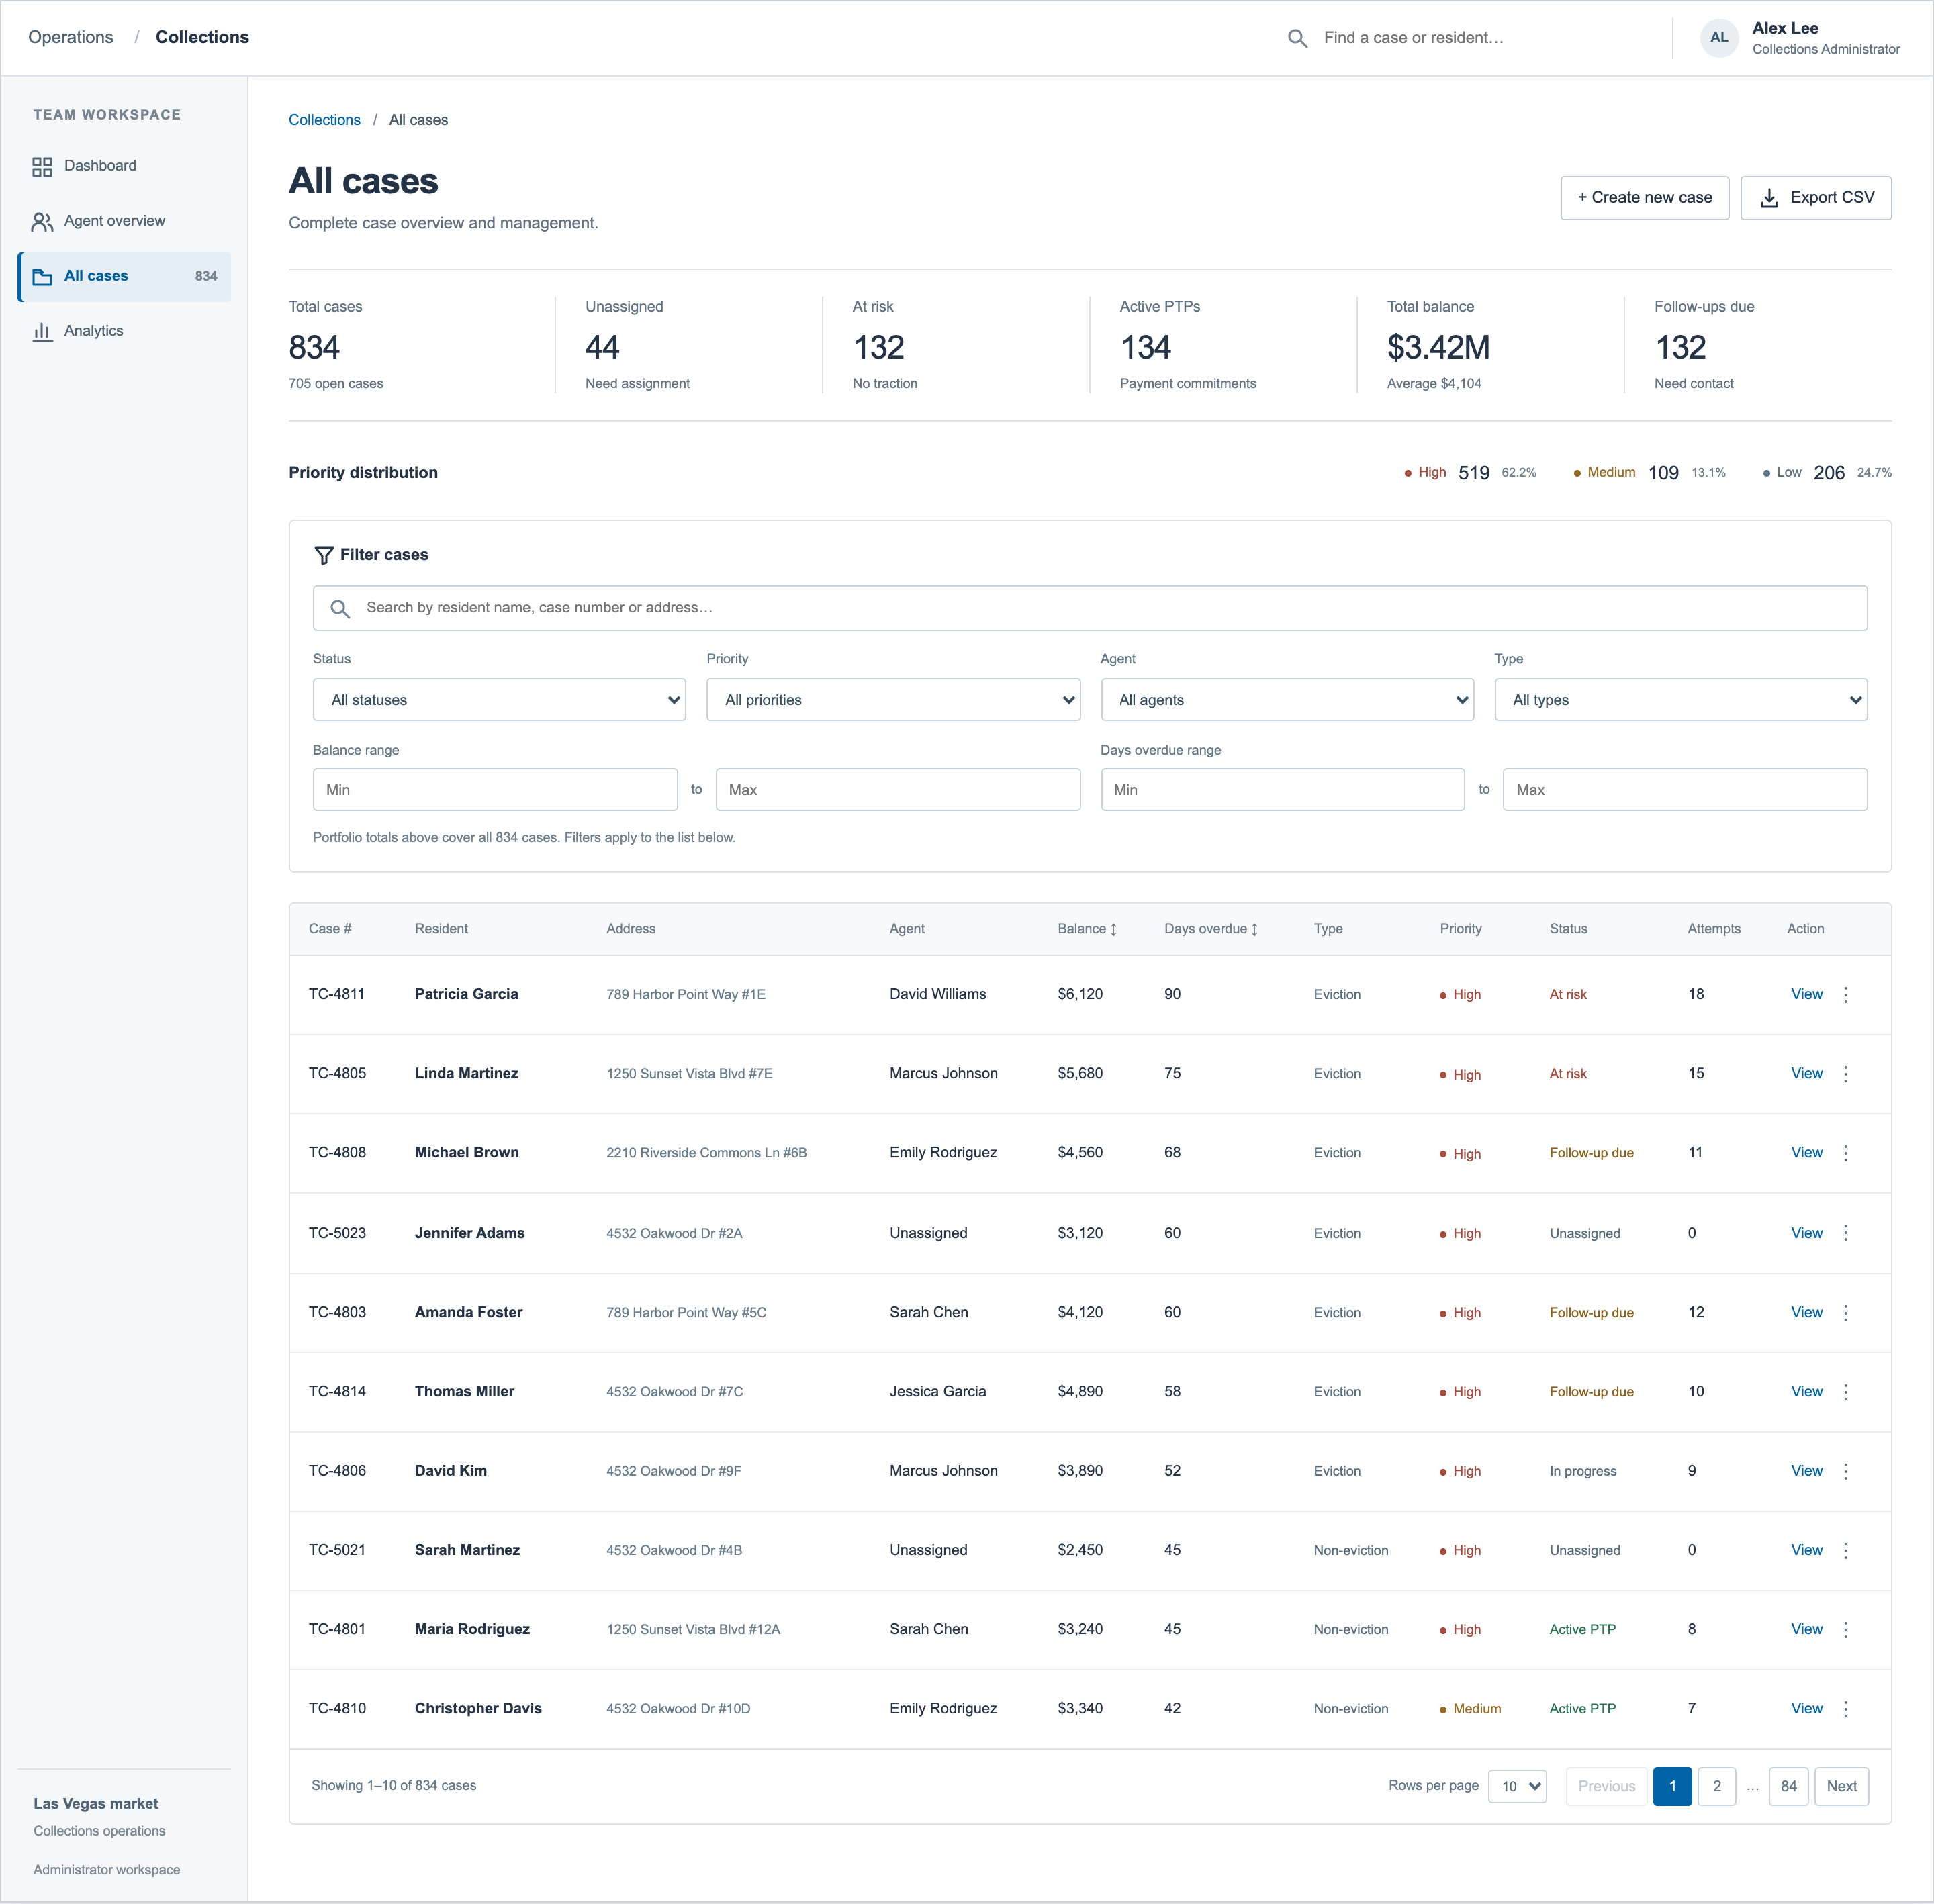
03 / All cases
Search, filters and pagination make a large caseload navigable. This view shows the first 10 of 834 illustrative records.
 Inspect full-size image ↗
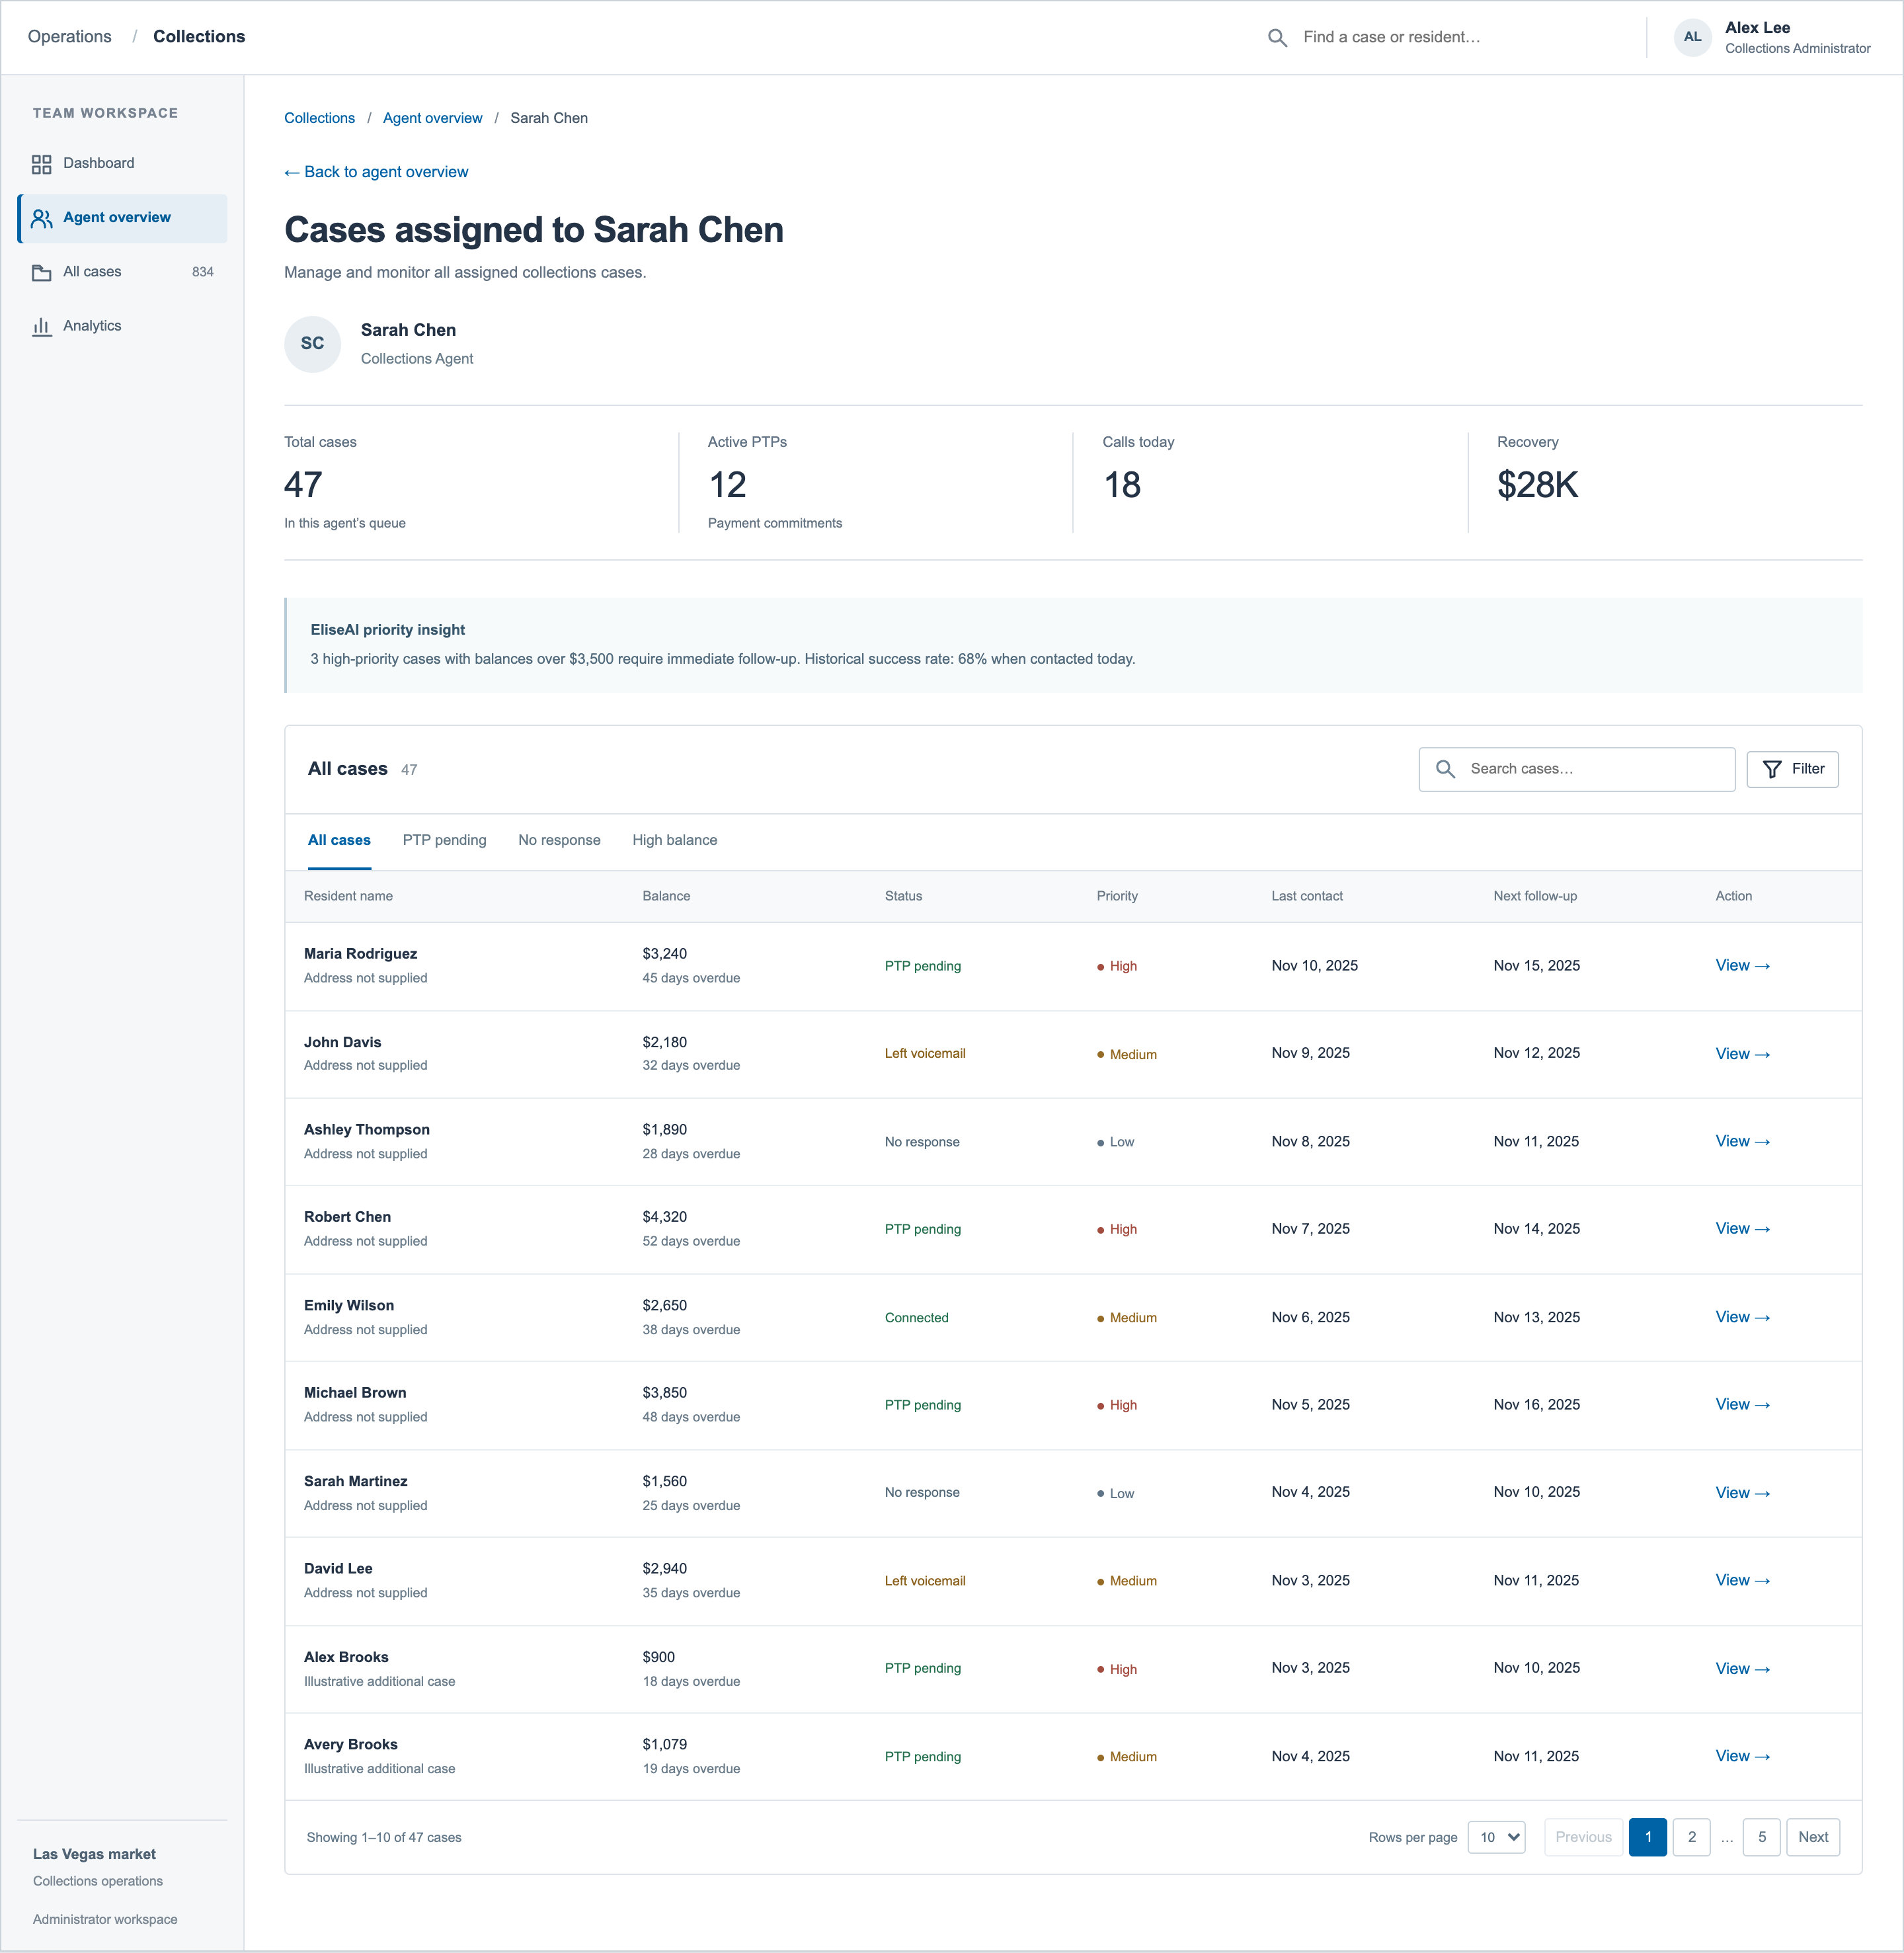
04 / Agent queue
The administrator can narrow their review to Sarah Chen’s 47 assigned cases, including commitments and follow-up dates.
 Inspect full-size image ↗
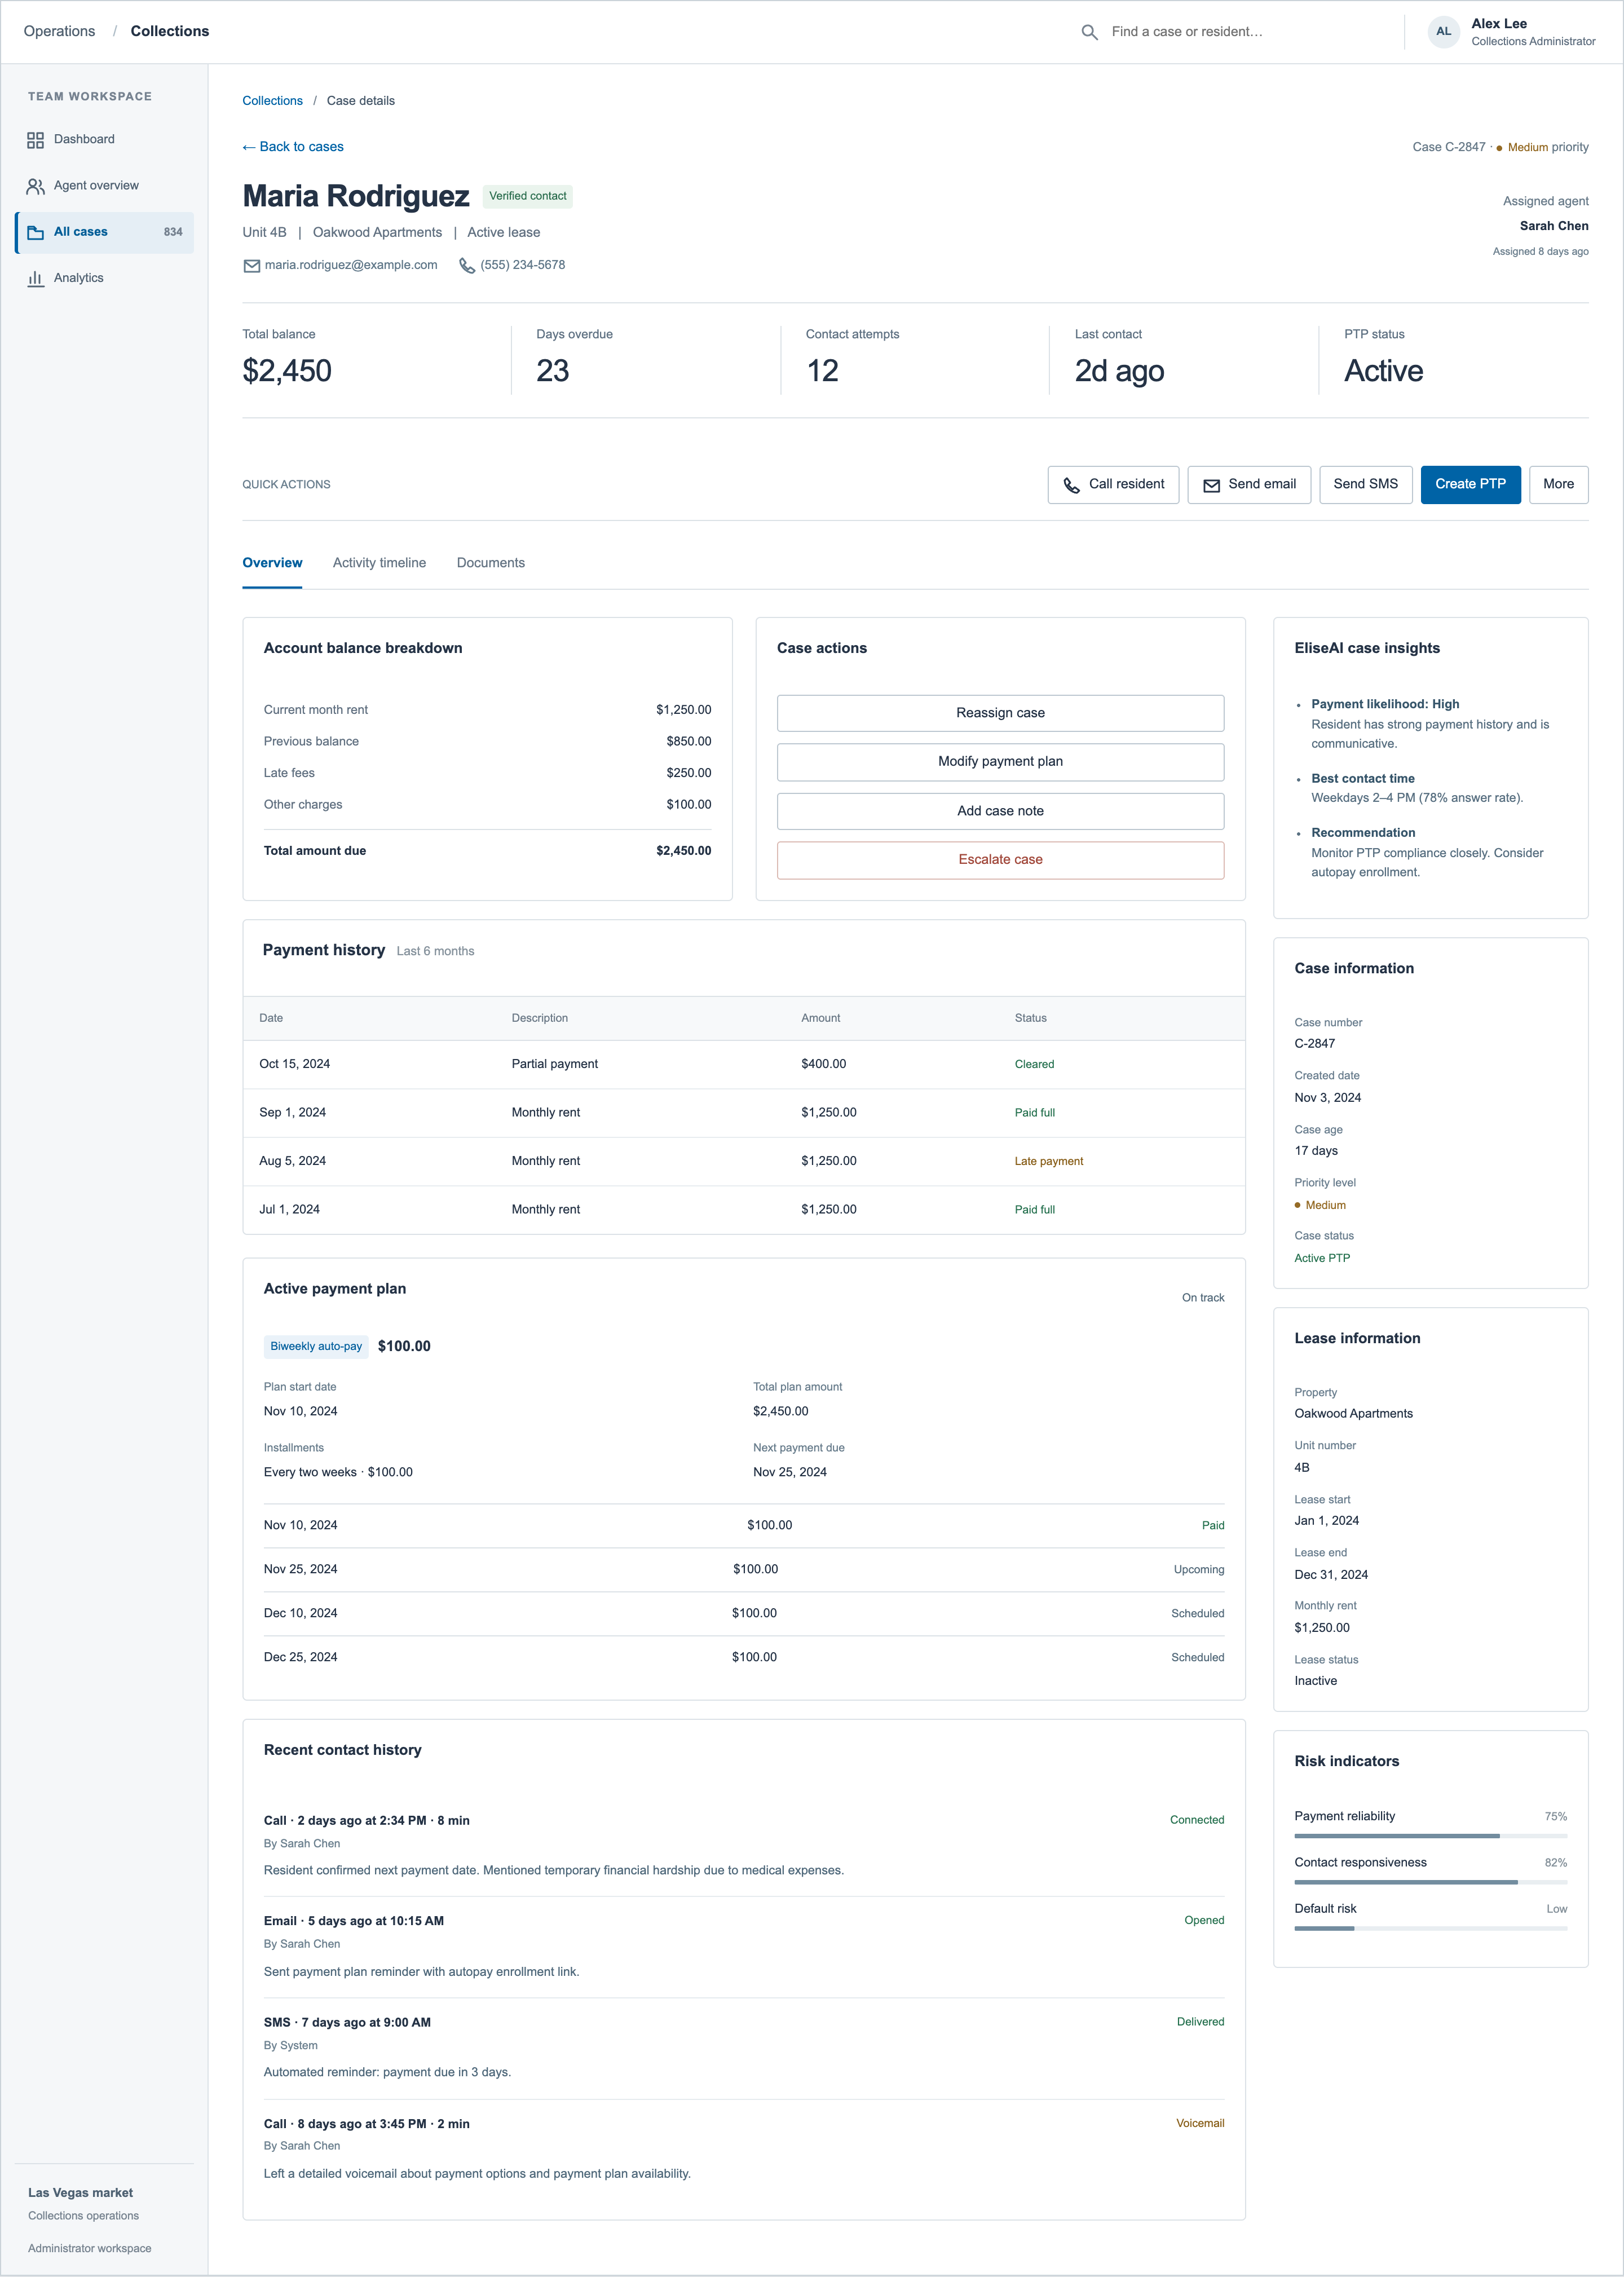
05 / Administrator case details
Account information sits alongside ownership, payment arrangements and administrator actions. This is a separate example scenario from the agent account in the main case study.
 Inspect full-size image ↗
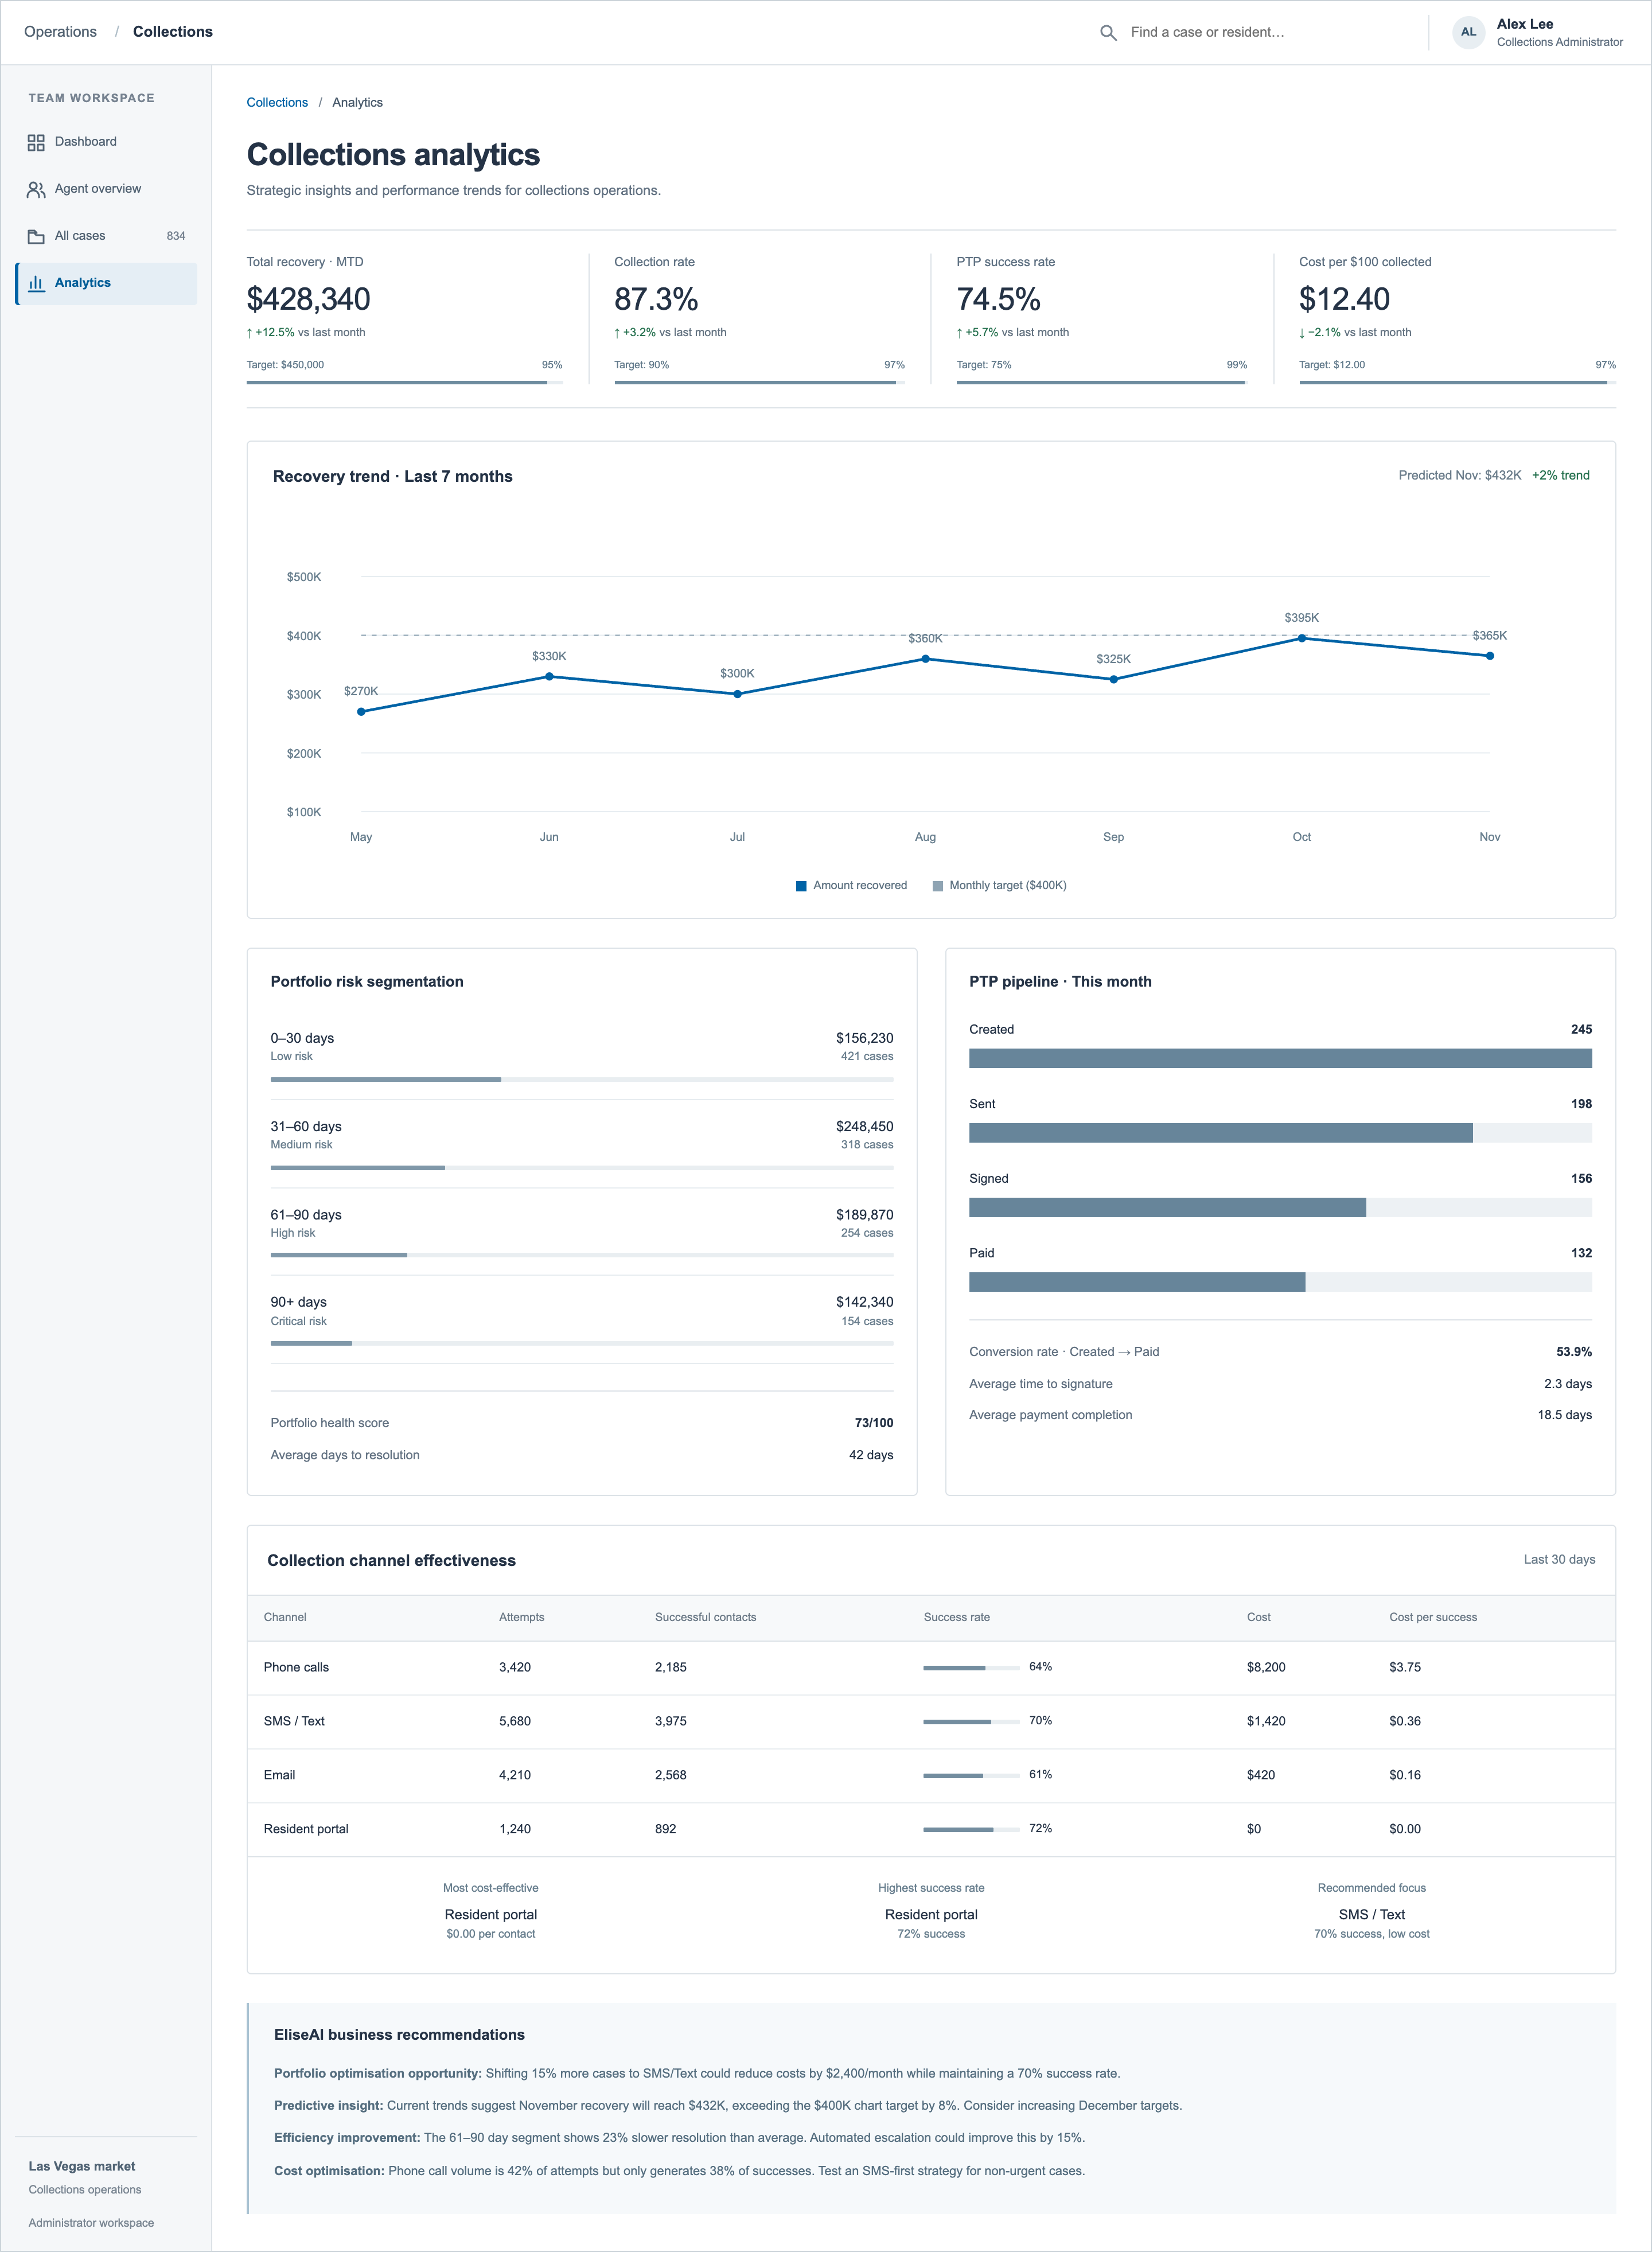
06 / Analytics concept
An exploratory view of recovery, portfolio risk and contact channels. All figures and forecasts are illustrative; metric definitions, reporting periods and targets would need validation before implementation.
 Inspect full-size image ↗